How It Works
A guide to setting up and using GrandSpikeBot.
Welcome!
GrandSpikeBot is a high-speed cryptocurrency market monitoring tool. Its primary purpose is to identify significant price movements within a selected time period with minimal delay and detect assets across the market exhibiting abnormal activity or substantial volatility spikes before they become obvious to most market participants.
Contents
Introduction
In financial markets, volatility creates opportunities, and speed of reaction allows traders to take advantage of those opportunities. The bot monitors hundreds of trading pairs and highlights assets experiencing significant price movement. Fast notifications allow you to react quickly to changing market conditions.
However, a notification is not a trading signal by itself. It simply indicates that a significant market event is occurring and that the chart deserves further analysis. Before entering any position, always consider the broader market context:
Bitcoin Factor (BTC)
Most altcoins remain correlated to Bitcoin to some degree.
- Lagging assets: If Bitcoin has already made a strong move while an altcoin remains in consolidation, a newly detected impulse may indicate the beginning of a catch-up move.
- Independent strength (Against the market): Sometimes an asset continues to rise despite weakness across the broader market. This may indicate strong buying pressure or asset-specific demand. Such situations deserve additional attention.
Flexible Configuration
The bot can be adapted to your individual trading style. You can adjust the analysis period (from 1 minute to 24 hours) and the price change threshold (from 1% to 100%). GrandSpikeBot can be used alongside your existing trading systems, including indicators, support and resistance levels, Smart Money Concepts, and other analytical approaches.
Market Uncertainty
Markets remain probabilistic environments where any scenario can fail. Risk management and protective stop orders remain essential components of trading. Even perfect analysis cannot guarantee a profitable trade.
Setup
- Launch GrandSpikeBot.
- Activate the bot using the activation code "Spike".
- Open the Settings section and configure the maximum time period over which the bot will track price changes, as well as the percentage price movement required to trigger a notification.
- Purchase a subscription. Market scanning will start automatically after activation.
- If necessary, select your preferred exchange for quick access directly from notifications. TradingView is used by default. The feature works on both desktop and mobile devices. For Bybit, direct opening in the mobile application is supported.
- The Profile section displays your current settings and subscription information. It also contains the Stop Scanning button, which should be used whenever the bot is not needed.
- If you encounter technical issues or have questions, use the Help section to contact support.
Trading Strategies
Strategy 1. Trend Following and Shadow Reversal
Concept: Entering in the direction of a strong impulse with the expectation of continuation, or trading the potential exhaustion of the move.
Bot Settings:
- Analysis period: 3m - 10m
- Price change threshold: 3% - 5%
Scenario A (Momentum Continuation)
After receiving a notification, open the chart and evaluate trading volume. If volume is increasing and there are no significant support or resistance levels ahead, entering in the direction of the move (Long or Short) may be considered. If the signal appears early in the move, a market entry may be appropriate. If the move is already extended, it may be preferable to wait for the next candle or a local pullback before entering. In some cases, skipping the setup is the best decision.
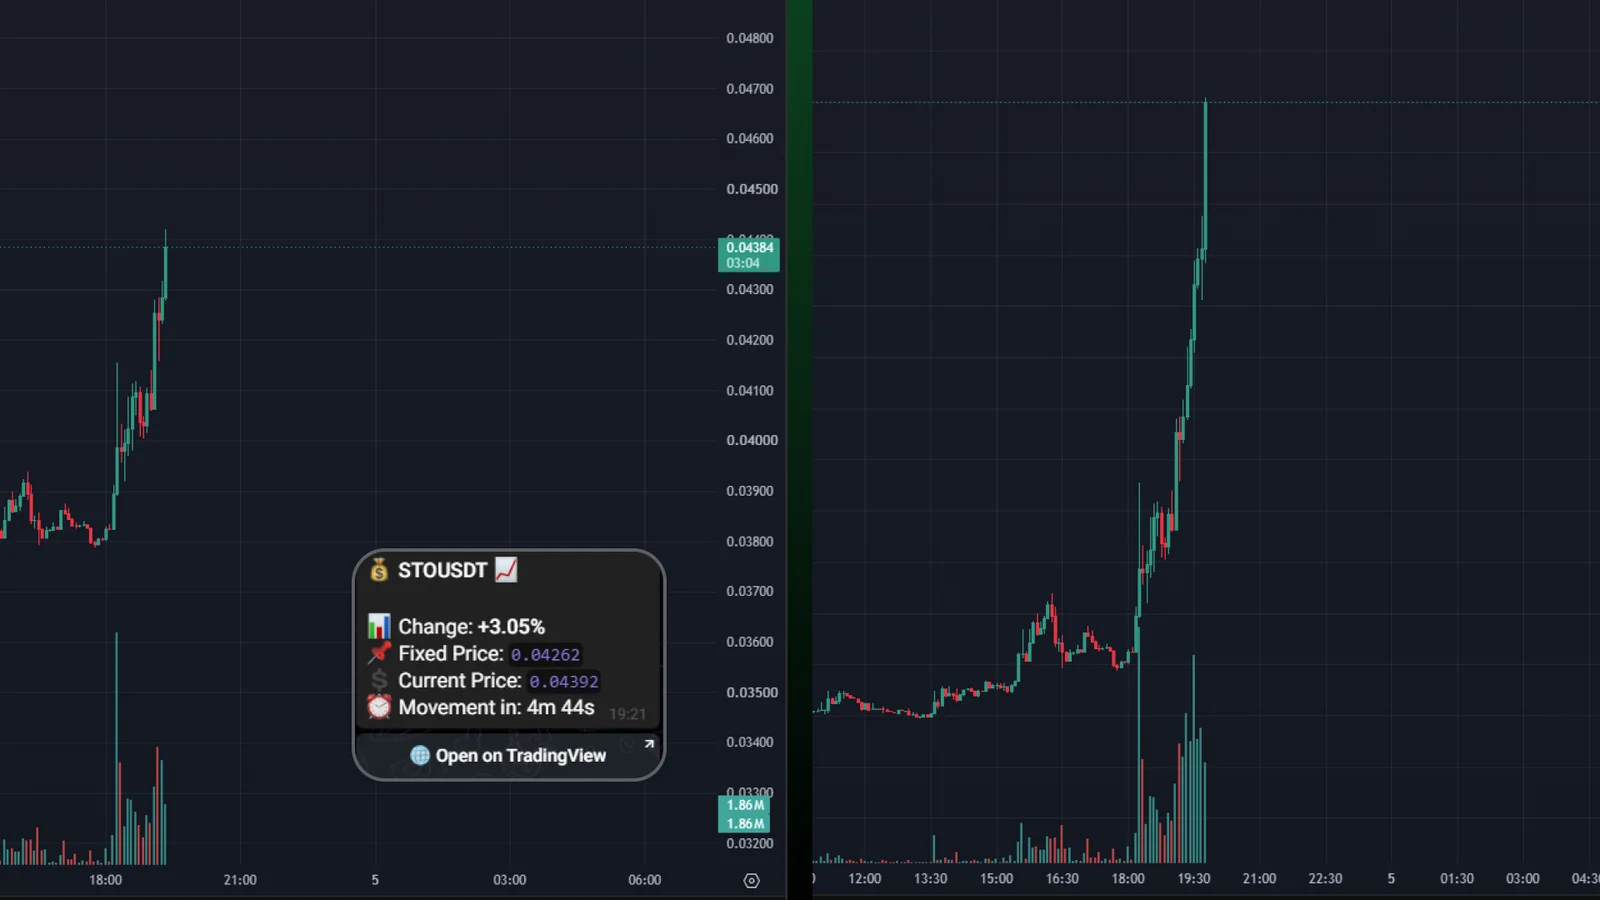
Example of a STOUSDT notification: date 04.08.2026, time 19:21 (UTC+4), timeframe 5m. A price increase of +3.05% was detected. The chart shows a rapid price increase with rising trading volumes during the early stage of the upward impulse. Following the notification, the price continued moving upward, gaining approximately another 11.5% over the next 25 minutes.
Scenario B (Shadow Reversal)
If momentum begins to fade and the current candle forms a long wick, it may indicate the beginning of a correction or the end of the move. In such situations, a counter-trend trade may be considered after candle close, with a stop-loss placed beyond the wick extreme.
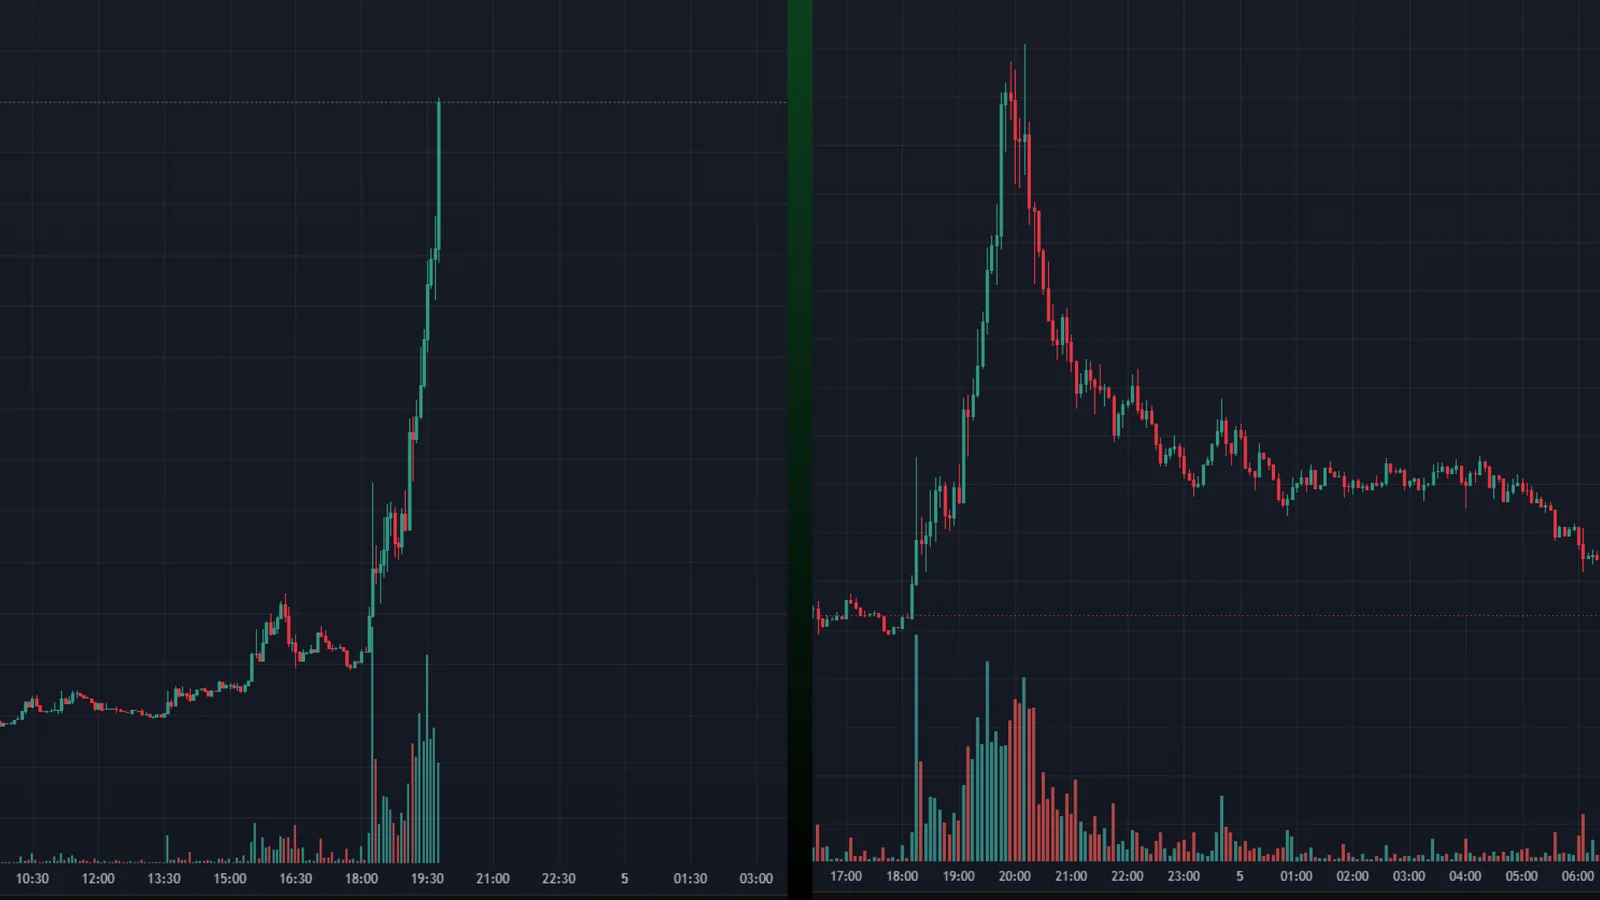
Continuation of the STOUSDT example: after the rapid rise, the impulse began to lose momentum, and the candle formed a long upper wick. After a local high was formed, a correction began, and the price declined by approximately 16% over the next 5 hours.
Strategy 2. Abnormal Spike / Reversal ("Knife Catching")
Concept: Identifying short-term market inefficiencies where price makes a sharp move within a very short period without an obvious fundamental catalyst.
Bot Settings:
- Analysis period: 3m - 5m
- Price change threshold: 3% - 10%
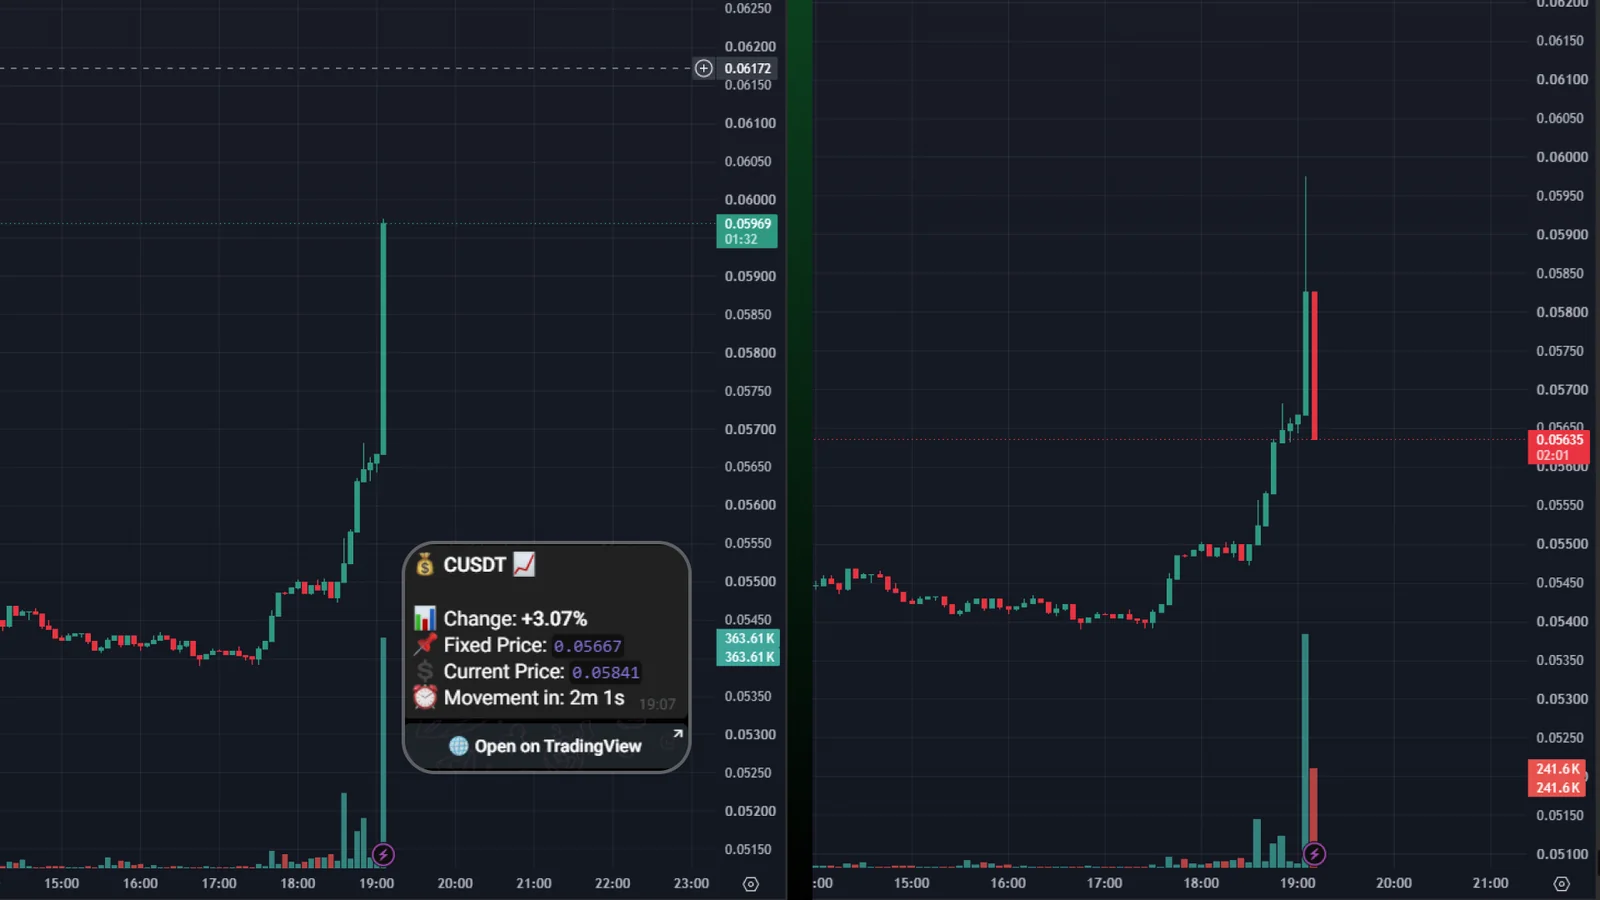
Example of a CUSDT notification: date 30.07.2026, time 19:07 (UTC+4), timeframe 5m. A price increase of +3.07% was detected over 2 minutes. The chart shows an unusually large candle accompanied by exceptionally high trading volume. We switch to a lower timeframe and wait for signs of a reversal. The price subsequently declined by approximately 5% over the next 5.5 minutes.
Important Rule
Do not trade against an actively developing impulse until clear signs of slowing momentum appear.
Execution
Wait for the speed of the move to decrease and for signs of reaction from major liquidity zones or significant support/resistance levels. A reversal trade should only be considered after confirmation that the impulse is weakening and conditions for a counter-move are forming.
Strategy 3. Flash Crash
Concept: Trading extreme selloffs caused by liquidation cascades and panic selling. Such moves often generate high volatility and can lead either to further downside or to a sharp recovery.
Bot Settings:
- Analysis period: 5m - 15m
- Price change threshold: 10% - 20%
Scenario A (Continuation of the Selloff)
After receiving a notification, evaluate market structure. If price continues to decline aggressively, breaks key support levels, and shows no signs of slowing down, trading in the direction of the move may be considered. The expectation in this scenario is continued downside driven by panic selling.
Scenario B (After Momentum Weakens)
If the decline begins to slow and price reacts to a significant support or liquidity area, two scenarios may be considered:
- Technical Bounce: placing limit orders near the expected exhaustion zone in anticipation of a quick recovery.
- Confirmed Recovery: waiting for a reversal structure, reclaim of important levels, or clear signs of renewed demand before entering. The entry occurs after confirmation, not during the selloff itself.
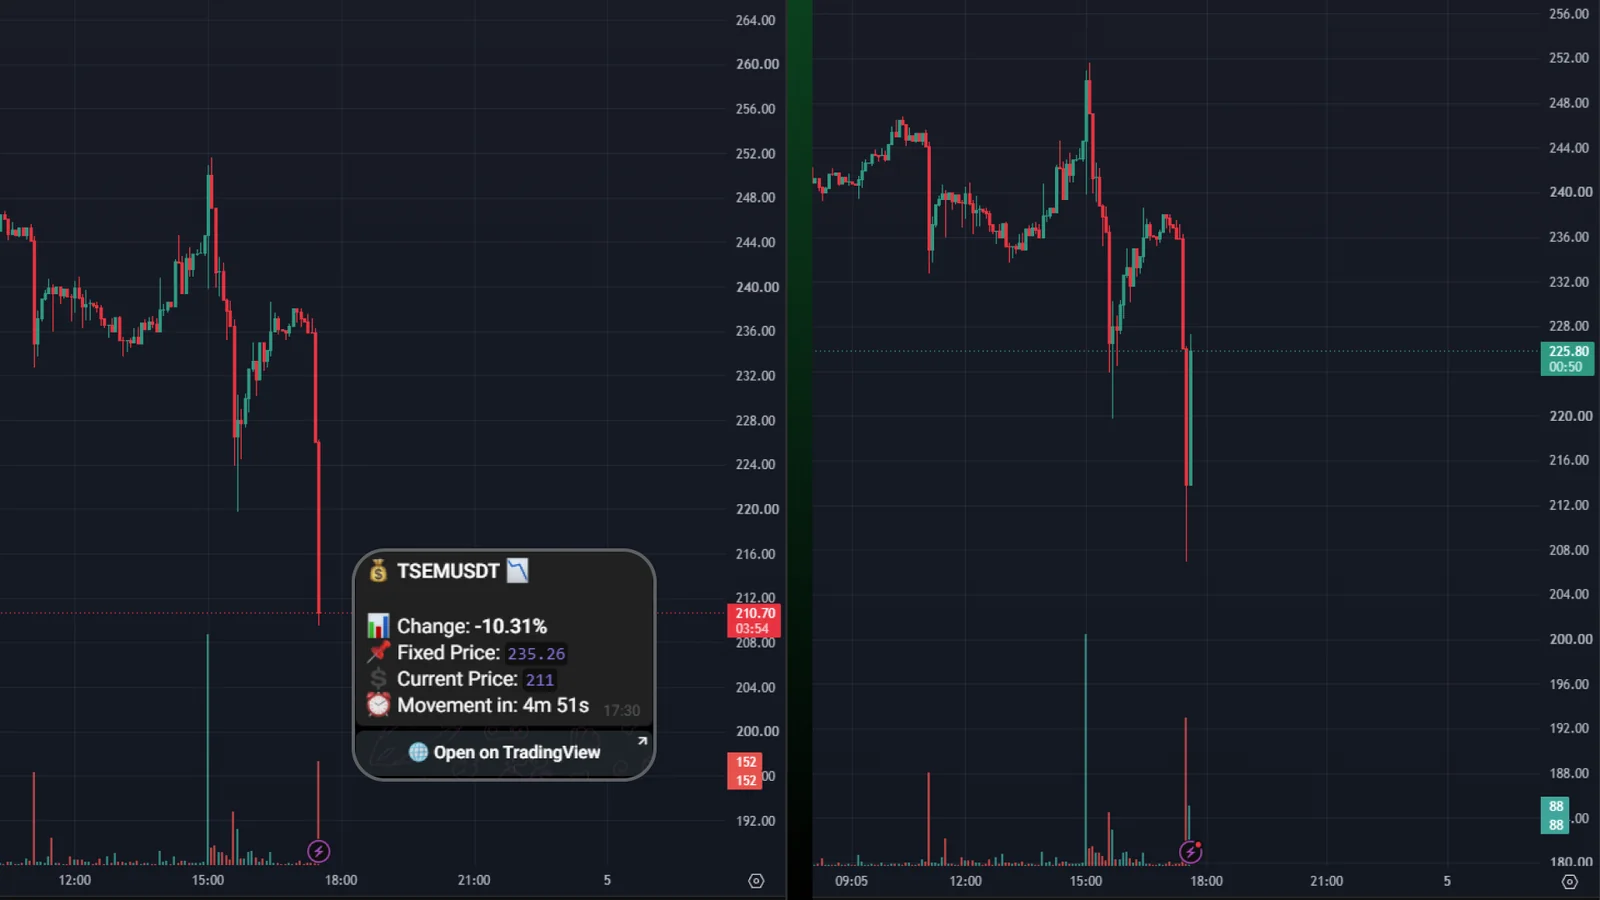
Example of a TSEMUSDT notification: date 04.08.2026, time 17:30 (UTC+4), timeframe 5m. A price decline of -10.31% was detected. The chart shows a sharp decline over two large candles, with the latest candle accompanied by unusually high trading volume. We switch to a lower timeframe and look for signs of either continuation or reversal. A long lower wick then forms, indicating rejection of lower prices, after which the price quickly rebounded by approximately 7%.
Strategy 4. Hidden Accumulation (Pumps and Global Anomalies)
Concept: Identifying assets that demonstrate sustained growth over an extended period, potentially indicating increased demand and the formation of a strong directional trend.
Bot Settings:
- Analysis period: 12h - 24h
- Price change threshold: 20% - 40%
After receiving a notification, switch to higher timeframes (4H, 1D) and evaluate the overall structure. Pay special attention to assets breaking out of prolonged consolidation ranges or reaching significant highs.
Scenario A (Momentum Acceleration)
The majority of the move may be occurring at the moment the notification arrives, with price rapidly accelerating higher. In this situation, it is important to determine whether the move is still in its early stages or whether a significant portion of the advance has already occurred. If acceleration is accompanied by increasing volume, new local highs, and no nearby resistance zones, an entry in the direction of the move may be considered. If the move already appears significantly extended, it is generally preferable to wait for a pullback, consolidation, or the formation of a new entry opportunity.
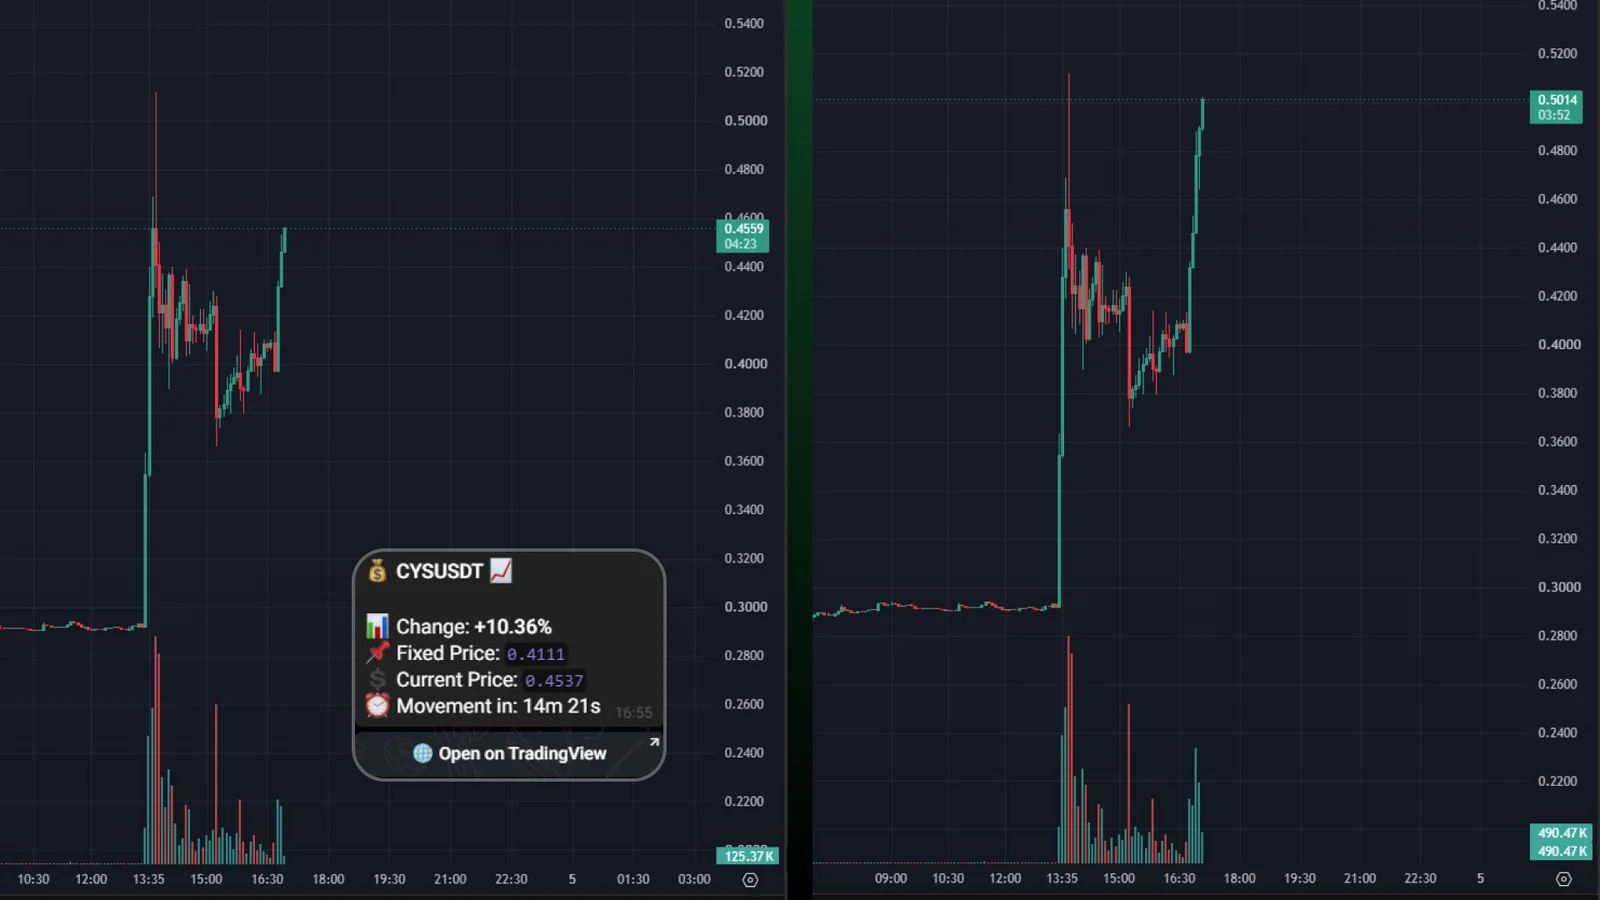
Example of a CYSUSDT notification: date 04.08.2026, time 16:55 (UTC+4), timeframe 5m. A price increase of +10.36% was detected. The chart shows the beginning of a rapid price increase with elevated trading volumes following a correction of the preceding pump. The upward movement then continued, and the price increased by approximately another 10% over the next 10 minutes.
Scenario B (Organic Trend Development)
Price rises steadily, candles remain moderate in size, and volume increases without major spikes. Such behavior may indicate gradual accumulation by larger market participants. Long entries may be considered on pullbacks to support levels or during retests of previously broken horizontal resistance.
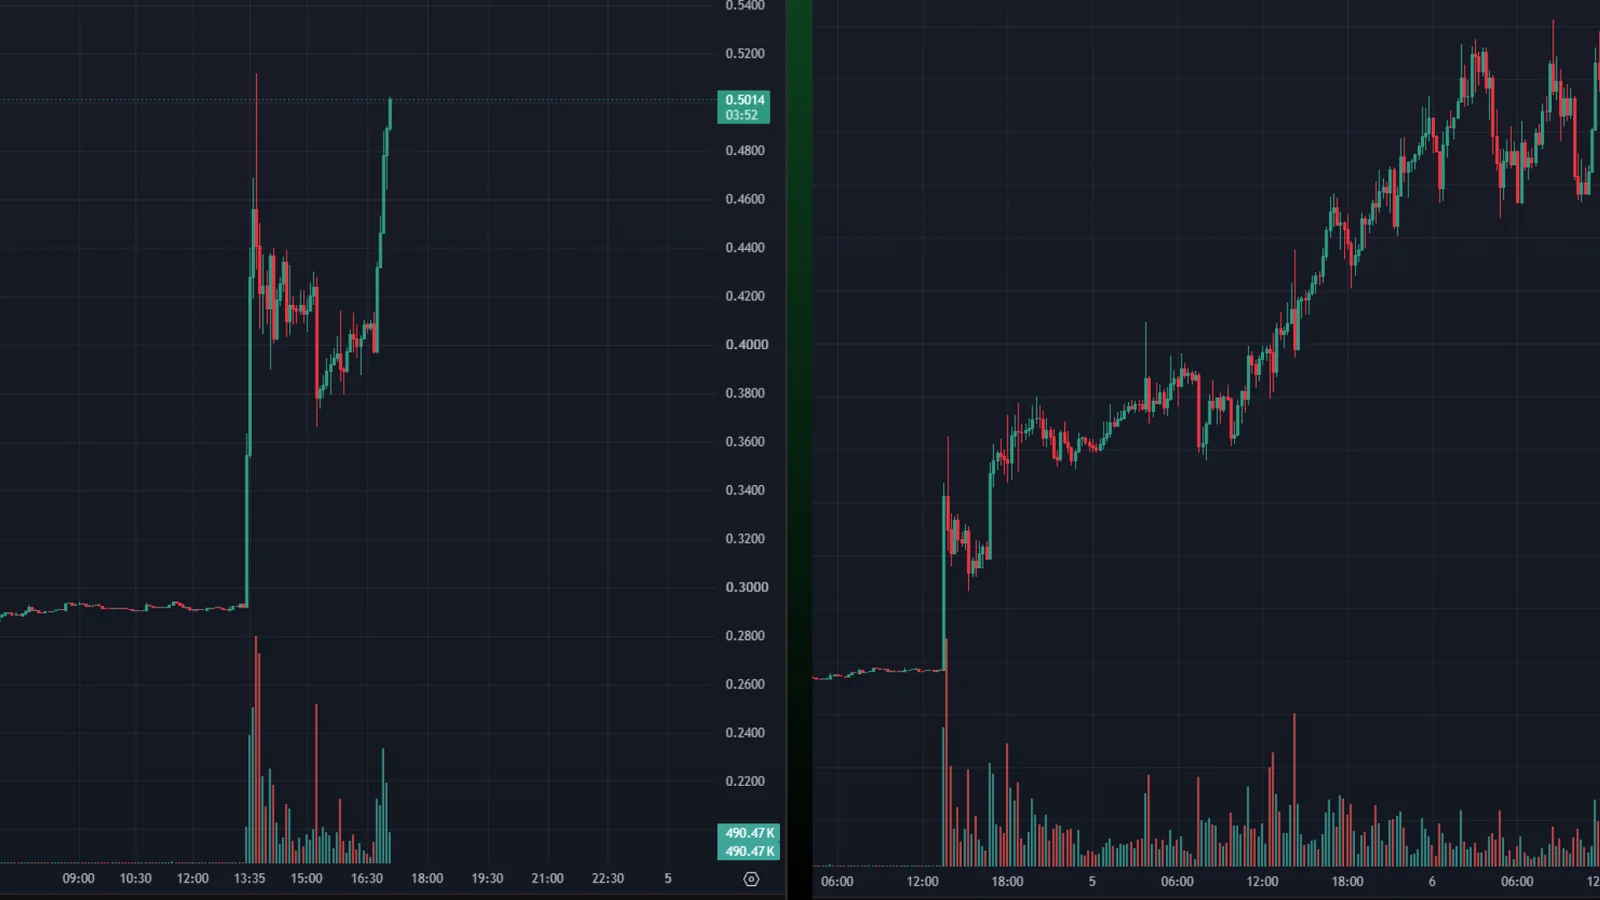
Continuation of the CYSUSDT example (15m timeframe on the right): on the higher timeframe, the price maintained its upward trend and continued to rise. Over approximately 1.5 days, the price increased by around 90%. In such a situation, you can hold the initial position or consider a new entry based on the expectation of further continuation of the longer-term trend: after the initial pump, the asset attracted increased attention, and trading activity increased significantly.
All strategies presented above are examples of how GrandSpikeBot can be used and do not represent the only possible approaches.
Analysis parameters may be adjusted according to market conditions and individual trading styles. Feel free to experiment with different settings, combine approaches, adapt the tool to your own strategies, or use notifications as triggers for independent market analysis.
Recommendations
It is recommended to evaluate asset liquidity before entering a trade.
Low-liquidity assets are prone to sharp price fluctuations even with relatively small trading volumes, increasing the risk of slippage and making position exits more difficult. Particular attention should be paid to 24-hour trading volume (Volume 24h). When volume is low, a move may fail to develop further due to insufficient market participation.
At the same time, sudden increases in trading activity on low-volume assets can sometimes mark the early stages of strong momentum moves. Such situations may offer opportunities but require increased caution.